
Attract and measure
Cost per lead and cost per sale: how to interpret them
Cost per lead and cost per sale look easy to calculate, but they vary a lot depending on what you count as a lead, which period you use and which costs you include. This guide explains the formulas, time windows and how to read results without comparing yourself to external benchmarks.
In this guide
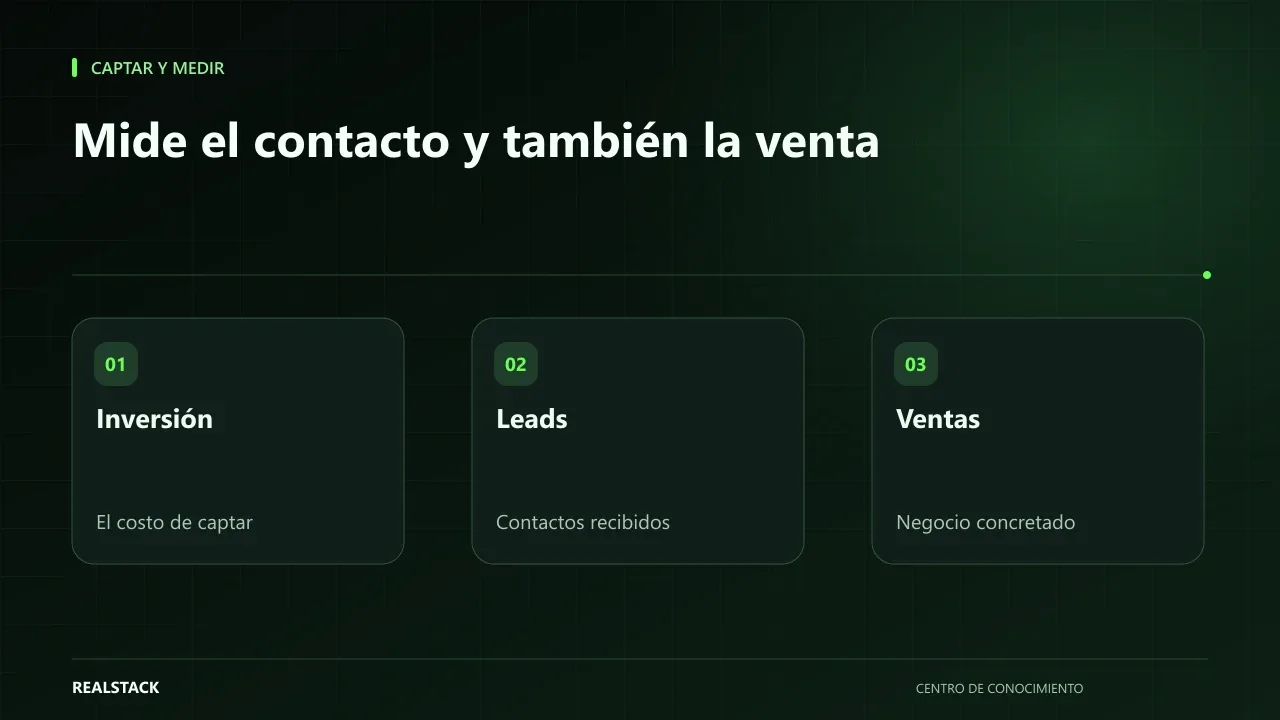
Two numbers that are easily confused
One report says each lead cost you little and another says each sale cost you a lot. Both can be true at the same time, because they measure different things. Cost per lead measures how much it costs you to get someone to raise their hand. Cost per sale measures how much it costs you to get someone to buy. The second is what covers payroll; the first helps you know if the funnel is filling.
The formulas
| Metric | Formula | What to include in cost |
|---|---|---|
| Cost per lead (CPL) | Cost for the period ÷ leads in the period | Media investment; optionally management fees |
| Cost per sale (CPV) | Cost for the period ÷ sales attributed to the period | Same costs as in CPL, so you can compare |
| Closing rate | Sales ÷ leads | Not a cost; connects the two metrics |
Decide from the start what you include in “cost.” If you include only media spend, the number serves to compare campaigns with each other. If you include fees and tools, it gets closer to the real cost of acquiring a customer. Neither option is wrong; what’s wrong is mixing them between months.
What counts as a lead
A click on the WhatsApp button is not the same as a conversation with a real need. Define in writing what a lead is in your company: for example, a contact who requested information about a product or service you sell. Ad platforms call the action you configure a “conversion,” so their count depends on that configuration.
Time windows
In B2B sales, a March lead can become a sale in May. If you divide May’s cost by May’s sales, you mix leads from different months. There are two ways to handle this:
By cohort: take the leads from one month and wait to see how many convert, even if they close later. It’s more exact, but it takes time.
By period: divide cost and sales for the same period. It’s faster and acceptable if your sales cycle is short or stable.
Google Ads has its own “conversion window,” the period after the click during which it records a conversion. Consider that window when you compare to your data.
Procedure
- Write your definition of lead and sale.
- Decide which costs you include and keep it consistent.
- Choose whether to measure by cohort or by period.
- Record cost, leads and sales by month and by channel in the template.
- Calculate CPL, CPV and closing rate manually or in your spreadsheet.
- Compare against your own previous months, not against figures from other companies.
Applied example
How to read the results
- If CPL falls and CPV rises, you’re probably attracting lower-quality contacts.
- If CPL rises and CPV falls, you may be filtering better.
- If both rise, check campaigns, landing page and sales follow-up.
- With few sales, a single sale changes CPV a lot: don't draw conclusions from a single month.
Limits
This guide does not give benchmark figures by industry: we don’t use them because they vary by market, product and ticket, and comparing yourself with them usually confuses more than it helps. It also does not calculate return on investment, which requires margin and customer lifetime value.
Decision criteria
| If… | Use |
|---|---|
| Your sales cycle is measured in days | Period measurement |
| Your sales cycle is weeks or months | Cohort measurement |
| You want to compare campaigns | Media costs only |
| You want to know how much a customer costs | Media plus fees and tools |
How to use the downloadable template
- Write your definitions of lead and sale in the first notes row.
- Record cost, leads and sales by month and channel.
- Calculate CPL, CPV and closing rate manually or in your sheet.
- Compare with your previous months.
Criteria for reading the numbers
| If you see… | It may mean… | What to check |
|---|---|---|
| Low CPL and high CPV | Many low-quality contacts are arriving | Search terms, landing messaging, lead criteria |
| High CPL and low CPV | Few contacts, but good ones | If you can broaden reach without losing quality |
| Closing rate is falling | The type of contact or the sales process changed | Response times and quality of follow-up |
| Sharp month-to-month variations | Few sales in the sample | Use longer periods or cohorts |
Complete synthetic example
Synthetic example. A fictional company invests COP 3.000.000 per month in search. In September it obtains 60 leads and 4 sales: CPL of COP 50.000 and CPV of COP 750.000. In October it expands keywords and obtains 110 leads and 4 sales: CPL falls to COP 27.273, but CPV stays the same and the sales team spends almost twice as much time filtering contacts.
If the company only looked at CPL, it would conclude October was better. By looking at CPV and closing rate (6.7% versus 3.6%), it sees it paid the same per sale with more saleswork. It decides to review the new search terms, exclude those that don't generate opportunities and measure by cohort, because its sales take between three and six weeks to close. All figures are invented.
How to present the results
When you share these numbers with management, always show the definitions, the period and the number of sales behind each figure. A CPV calculated with two sales is not suitable to decide budget; state that explicitly. Compare against your own previous months, not against averages from other companies whose lead definition you don’t know.
How to know if it worked
- Lead and sale definitions are written and don’t change without notice.
- Each figure comes with its period and number of sales.
- Budget decisions are based on CPV and not only CPL.
Plan for the first four weeks
- Week 1: write definitions and method.
- Week 2: reconstruct the last three months.
- Week 3: calculate CPL, CPV and closing rate by channel.
- Week 4: present results with their limits and decide.
Diagnosis before starting
- Find how much you spent on ads in the last three months.
- Count how many sales you can attribute to those ads in your records.
- Write what you currently count as a lead.
| If your case is… | Do this |
|---|---|
| You don't know how many sales came from ads | First register the source; without that there is no CPV. |
| You have few sales per month | Use quarters instead of months. |
| You compare agencies or channels | Use the same definitions and costs for all. |
A second example, in contrast
Synthetic example. A fictional B2B software company gets only 15 leads per month with a high CPL, and management wants to cut the campaign. Looking at CPV by three-month cohort, it sees those leads close annual contracts and the cost per sale is reasonable for its margin. Unlike the first example, the high CPL was not a problem. Example invented.
What to do when something fails
- If the figures change a lot, check whether any definition changed.
- If sales are missing, check that the record retains the source.
- If you can’t calculate CPV, present only what you do measure and state that.
Common mistakes
- Changing the definition of lead from one month to another.
- Mixing costs with and without fees.
- Judging a campaign only by its CPL.
- Comparing with benchmarks from other countries or sectors.
- Drawing conclusions with very few sales.
Checklist
- Written definitions.
- Included costs kept constant.
- Chosen method.
- Comparison against yourself.
- Don't decide based on a single month with few sales.
Bring it to your business
Acquisition and Sales Metrics Template
CSV template to record cost, leads, and sales by month and channel, and to calculate cost per lead, cost per sale, and close rate. Includes an explanation of each calculation and does not contain executable formulas.
View resourceWhat is a good cost per lead?
The one that allows you to sell with margin. It depends on your ticket, your closing rate and your margin; that’s why it’s useful to compare yourself over time.
Should I include the sales team's salary?
To compare campaigns, no. To know how much it costs to acquire a customer, you can include it, always in the same way each month.
Which is better, lowering CPL or CPV?
It depends on the objective, but to decide investment CPV is usually more useful, because it reflects sales and not just contacts.
Do I include VAT in the cost?
Decide a rule and apply it consistently; consistency is what matters.
Keep exploring
Attract and measure
From campaign to sale: what to measure and how to connect the journey
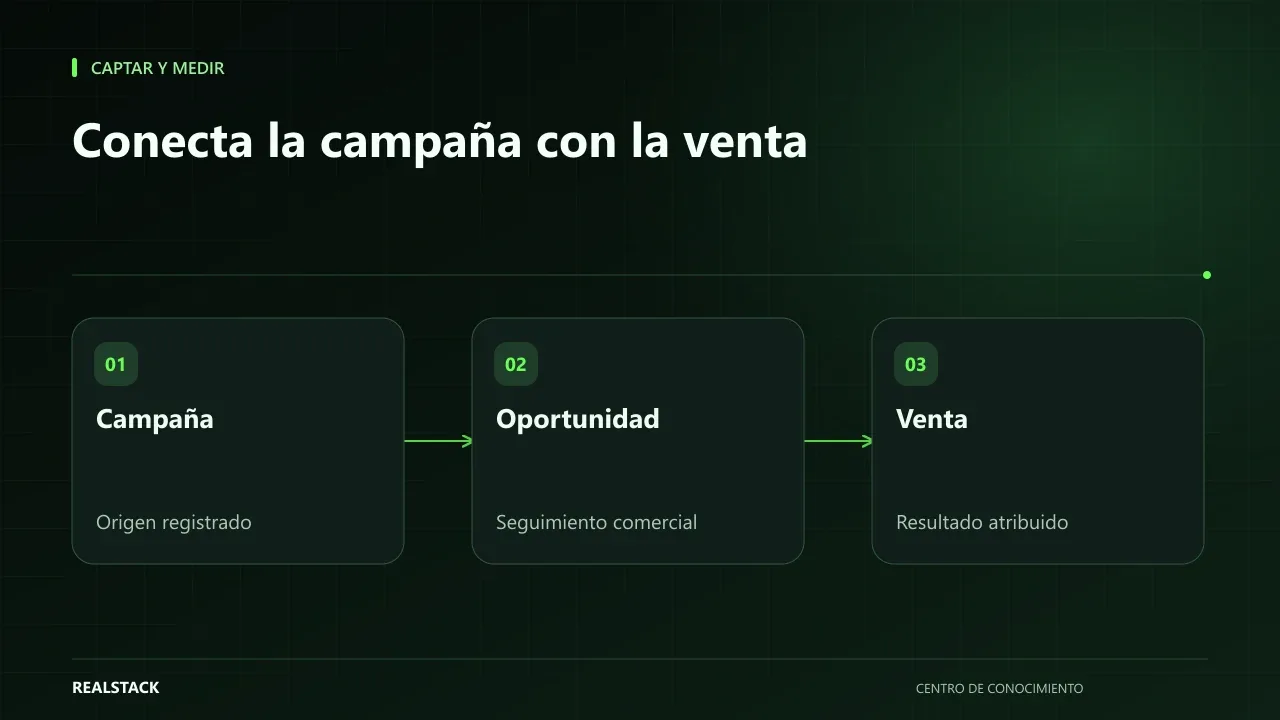
Knowing how many visits a campaign brought is little use if you don't know how many of those visits became sales. This guide explains how to connect the journey from visit to contact, opportunity and sale with source, UTM and identification, and what attribution and consent limits you should keep in mind.

Attract and measure
What a landing page needs to receive leads from Google Ads
A Google Ads campaign brings someone with specific intent; the landing page decides whether that person finds what they were looking for and knows what to do next. This guide reviews intent, value proposition, clarity, form or WhatsApp, measurement and mobile experience, without promising conversion rates.