
Evolve
How to measure whether an automation delivers value
An automation can work technically and still not deliver value if nobody uses it or if it generates more exceptions than it solves. This guide explains how to measure with a baseline, usage, time, errors and exceptions, and how to track results without inflating them.
In this guide
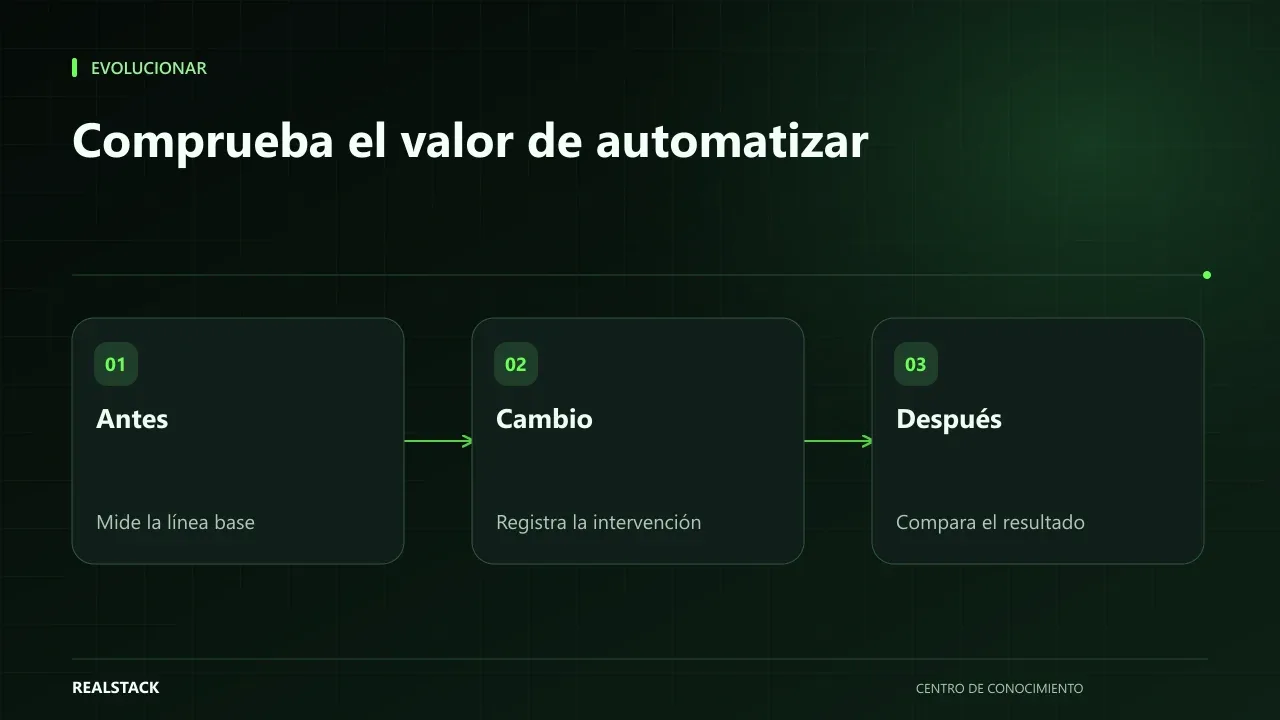
It works, but is it useful?
The vendor delivered the automation, tests passed and the flow runs without errors. Two months later, someone notices the team is still doing half the work by hand because “the automation doesn’t cover the rare cases.” Working is not the same as delivering value.
No baseline, no comparison
Before enabling an automation, measure how the work is done today: how often it occurs, how long each occurrence takes, and how many errors happen. If you didn’t measure it beforehand, reconstruct an estimate with the team and mark it as estimated. Without that starting point, any subsequent figure is an opinion.
Five indicators
| Indicator | Question | How to obtain it |
|---|---|---|
| Usage | How many times did it run versus how many times it should have run? | Tool log versus actual volume |
| Time | How much human time does each case require now? | Sampling with the team |
| Errors | How many cases went wrong? | Incident and complaint logs |
| Exceptions | How many cases required a person to resolve? | Manual-case register |
| Adoption | Did the team abandon the previous process? | Observation and conversation |
Google’s Site Reliability Engineering calls “toil” the manual, repetitive, automatable work that doesn’t deliver lasting value. Good automation reduces that work; bad automation moves it elsewhere.
Exceptions tell the truth
If an automation solves 70% of cases and the remaining 30% requires more work than before, the net balance can be negative. Record each exception with its cause. Often two or three causes explain the majority, and fixing them changes the outcome.
Tracking
- Record the baseline before enabling.
- Measure weekly during the first month.
- Review exceptions and group them by cause.
- Decide: adjust, expand, maintain or retire.
- Move to monthly measurement when it stabilizes.
Applied example
How to communicate the result
Report the numbers with their sources and limits: “estimated”, “one-week sample”, “excluding maintenance time”. An honest, modest figure builds more confidence than an inflated savings claim.
Limits
This guide does not calculate return on investment: for that you need development and maintenance costs, and the value of the freed time. The value of an automation can also be fewer errors or better customer experience, which don’t always translate into time savings.
How to use the downloadable register
- Record the baseline.
- Add one row per period.
- Mark each figure as measured or estimated.
- Note the cause of exceptions and the decision.
Criteria to decide after measuring
| Result | Suggested decision |
|---|---|
| It’s used, saves time and reduces errors | Maintain and document |
| It saves time but exceptions grow | Fix the rules before expanding |
| It’s used little | Find out why before investing more |
| No difference versus the baseline | Simplify or retire |
Full synthetic example
Synthetic example. A fictitious company automates sending quotes from its CRM. Before launching, it measures for two weeks: preparing a quote takes 25 minutes on average and one in ten contains a price error.
After a month with the automation: 80% of quotes are generated by it, time falls to 8 minutes and price errors to one in fifty. But the remaining 20% are exceptions: products with special pricing that the automation doesn’t handle, which advisors end up doing manually and with more delay than before.
The company groups exceptions by cause, discovers that almost all come from five clients with their own price lists, and decides to incorporate those lists in the next iteration. It communicates the result with its limits: time was measured on samples, not the entire universe. Example invented.
Common errors, explained
Measuring only whether the automation “works” confuses technical stability with value. An automation may never fail and still not save time because nobody uses it, or because exceptions consume the savings. Always measure against the baseline and inspect exceptions with the same care as the normal case.
How to know if it worked
- There is a baseline and measurements after the change.
- Exceptions are grouped by cause.
- The decision was documented.
Plan for the first four weeks
- Week 1: measure the baseline.
- Week 2: launch and record usage.
- Week 3: group exceptions.
- Week 4: compare and decide.
Diagnosis before starting
- Check whether you measured anything before launching the automation.
- Ask who uses it and who doesn’t.
- Look for error or exception logs.
| If your case is… | Do this |
|---|---|
| You don’t have a baseline | Measure the manual process now on a sample to compare. |
| Many exceptions | Group them by cause before expanding. |
| Nobody uses it | Interview users before investing more. |
A second contrasting example
Synthetic example. A fictitious company automates payment reminders. Usage is total and there are no exceptions, but overdue balances do not change. On review, it sees that delinquent customers don’t read email. It decides to change the channel rather than the automation. Unlike the first example, the problem wasn’t technical but in impact. Example invented.
What to do when something fails
- If the automation fails, activate the manual fallback procedure.
- If exceptions increase, review changes in rules or data.
- If there is no improvement, consider retiring it.
How to measure it with your own data
- Measure the process time on a sample of cases before and after.
- Count detected errors in both periods.
- Record exceptions and their cause.
- Note how many users use the automation versus how many could.
You don’t need special tools: a sample of twenty manually measured cases is usually enough to see the trend. Always mark whether a data point is measured or estimated. If improvement appears only in estimates and not in measurements, you still lack sufficient evidence to scale.
Common mistakes
- Not measuring the baseline.
- Counting only successful cases.
- Ignoring maintenance time.
- Declaring success after one week.
- Not retiring an automation that doesn’t work.
Checklist
- Baseline recorded.
- Usage, time, errors and exceptions measured.
- Exceptions grouped by cause.
- Decision made and documented.
- Results communicated with their limits.
Bring it to your business
Record of results and adoption of automations
CSV registry to track an automation's results: baseline, usage, time, errors, exceptions with root cause and decision per period. Helps distinguish between an automation that works and one that delivers value.
View resourceHow long should I measure before deciding?
Long enough to see the normal cycle of the process, including peaks. For weekly processes, one month usually gives a reasonable idea.
What if I didn’t measure beforehand?
Reconstruct an estimated baseline with the team, mark it as estimated and start measuring from now.
How long to measure?
At least one full cycle of the process; for monthly processes, two months.
What if I didn’t measure before automating?
Measure a sample of the remaining manual process now, or ask those who performed it for an estimate and clearly mark it as estimated.
Should I measure the cost of the automation?
Yes: include maintenance time and exception handling, not only the build cost. That makes the comparison with the manual process fair.
Keep exploring
Evolve
How to build a 90-day technology roadmap
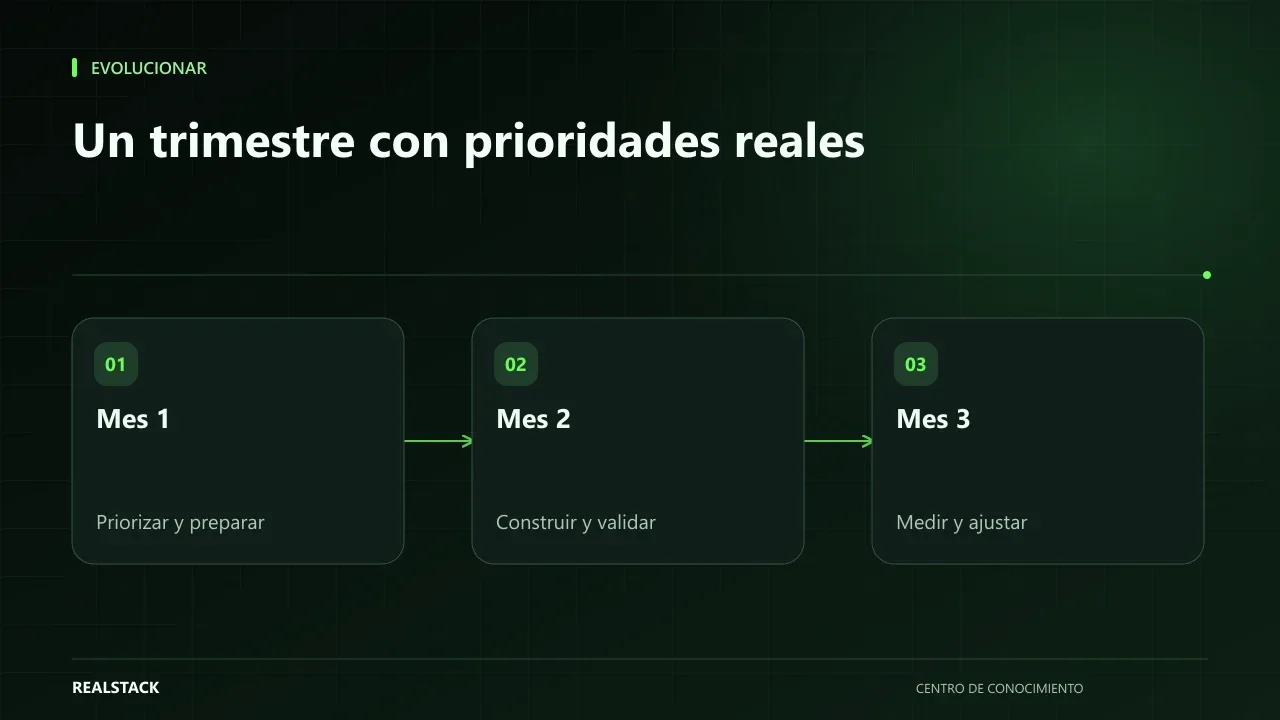
A 90-day roadmap is not a wish list with dates: it is a decision about what to do first with the capacity you actually have. This guide explains how to define goals, prioritize, map dependencies, estimate capacity, and review the plan each month.
Evolve
How to identify technical debt that is already affecting the business
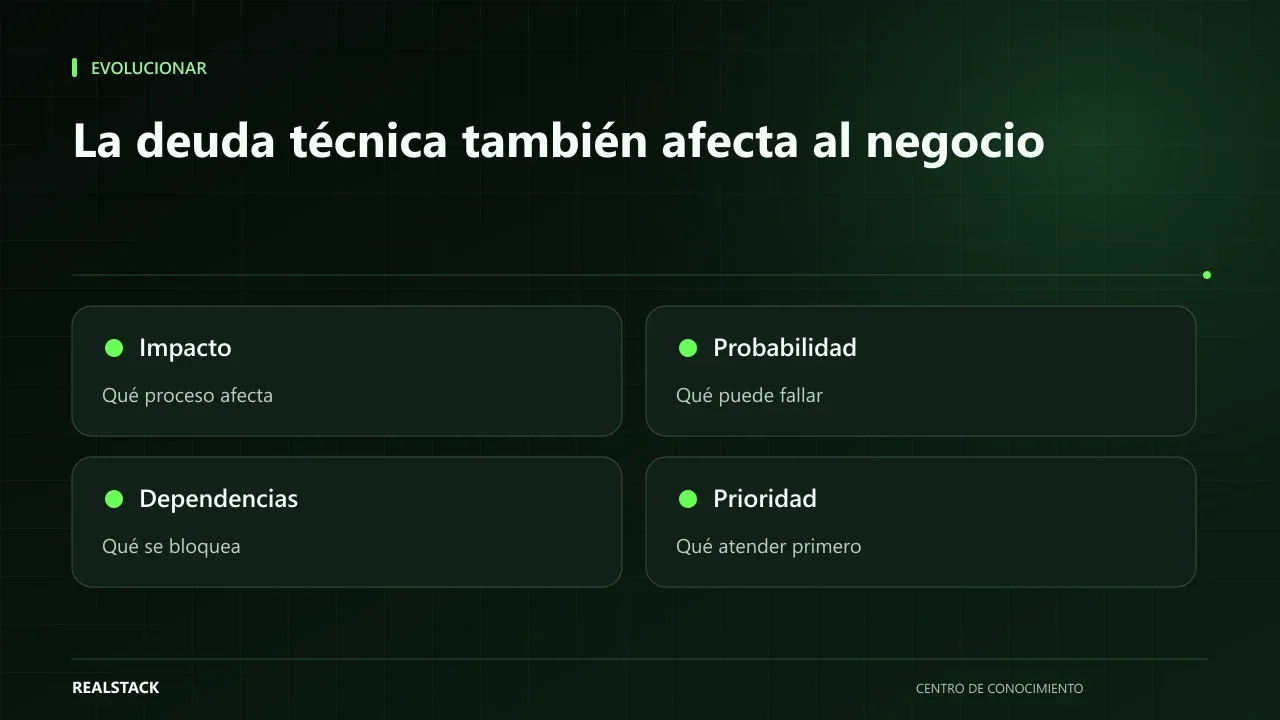
Technical debt is not just a developers' problem: it becomes a business problem when every change takes longer, errors recur, or no one dares to update. This guide explains how to recognize symptoms, gather evidence, estimate risk and prioritize, without diagnosing blindly.